Appendix D — Exercise 4 solutions
Comment on the way in which these results have been presented. Are the results clear? What has been done well? Is there anything you think could be improved? Do the results shown appear to be valid (from the information we are given)?

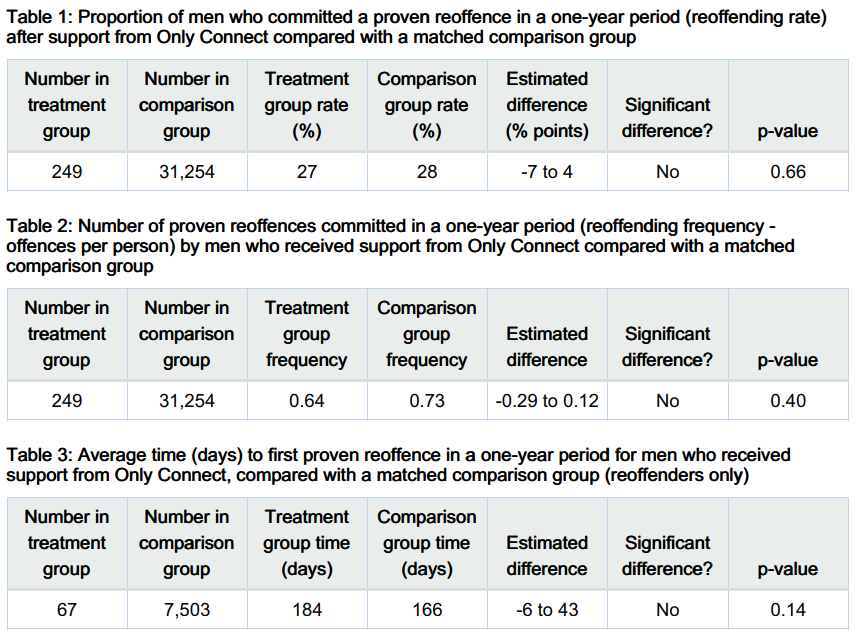
- Tables not the most exciting method of visualisations but they do provide all information in a clear format
- Not clear what the interval labelled ‘estimated difference’ is showing. I assume it is the confidence interval but no indication about the confidence levels used.
- All three tables have confidence intervals containing 0, or no difference. This shows each outcome is compatible with no difference between the intervention and control groups.
- This agrees with the relatively large p-values indicating no statistically significant differences between the groups.
- Example of a confidence interval interpretation (from table 3): we are 95% confident that individuals that received support committed their first re-offence between 6 days earlier (-6) and 43 days later than the control group on average. The p-value shows that we would expect this big of a difference (or more extreme) about 14 in 100 times if there were no differences at the population level. The difference is not statistically significant.

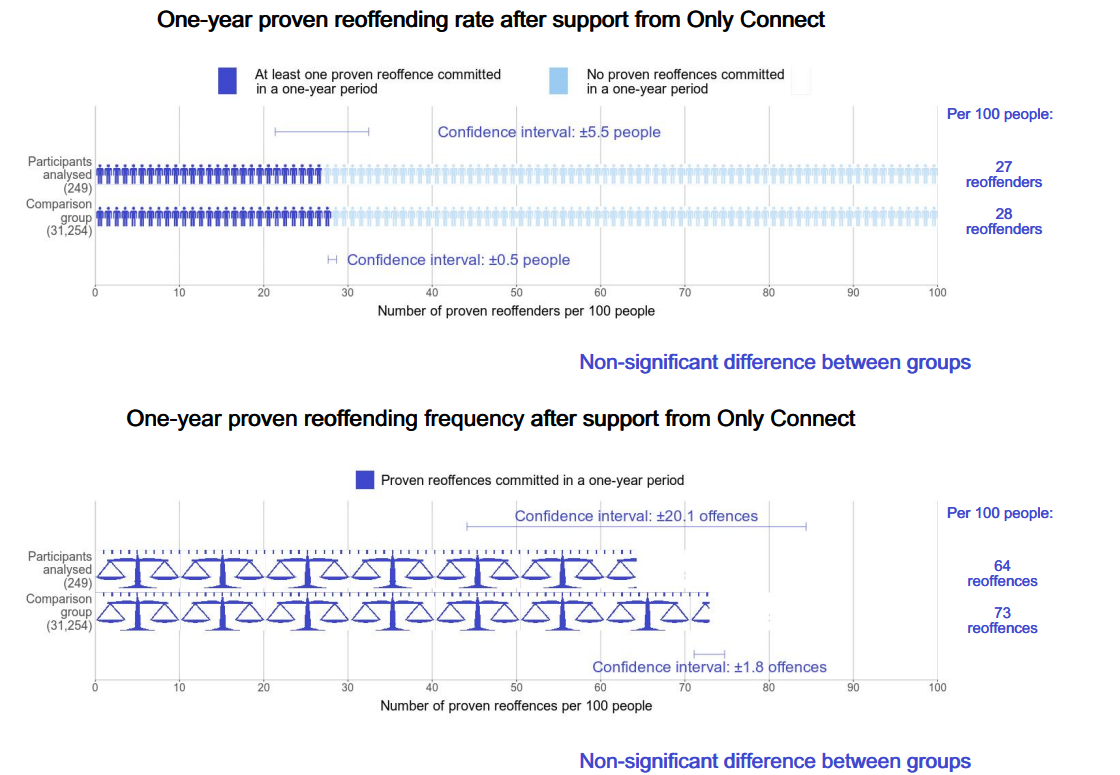
- Effective visualisations, eye-catching and clear (especially the first two). Nice use of annotations to ensure the values are clear
- Confidence intervals should not be given for each group separately as they are not comparable. Confidence intervals should only be given for the parameter that we are trying to find at the population level. In this case, we are interested in the confidence interval of the differences. Comparing the separate confidence intervals is not valid.