Exercise 2: data visualisation
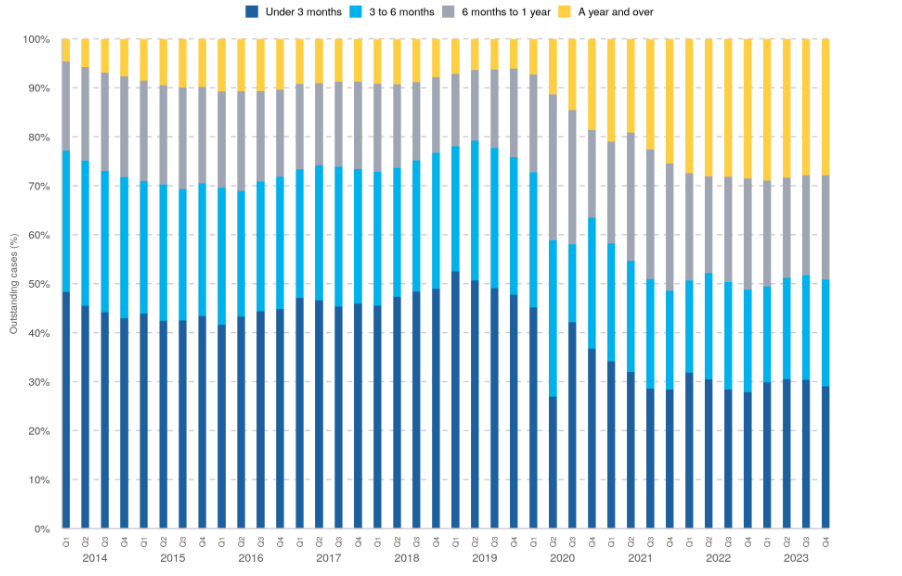
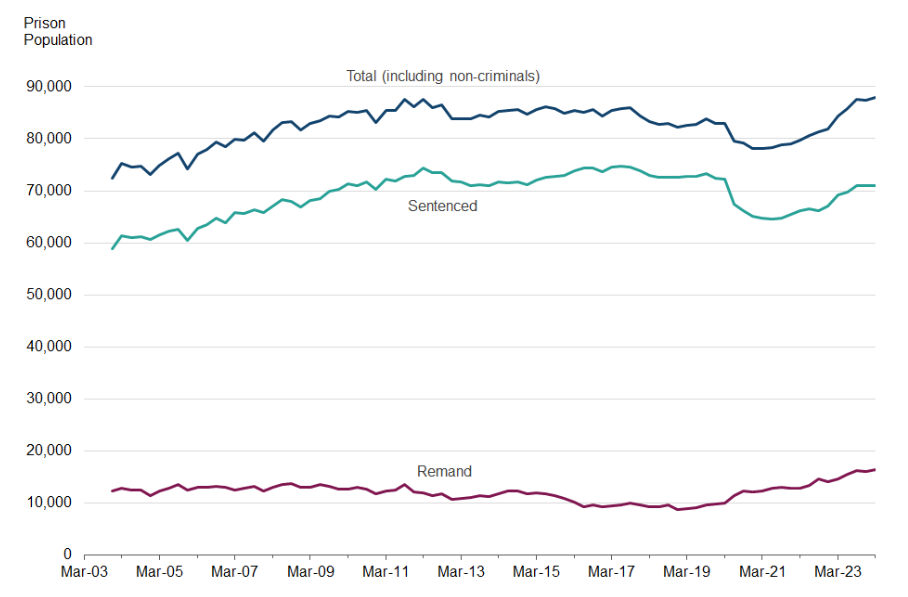
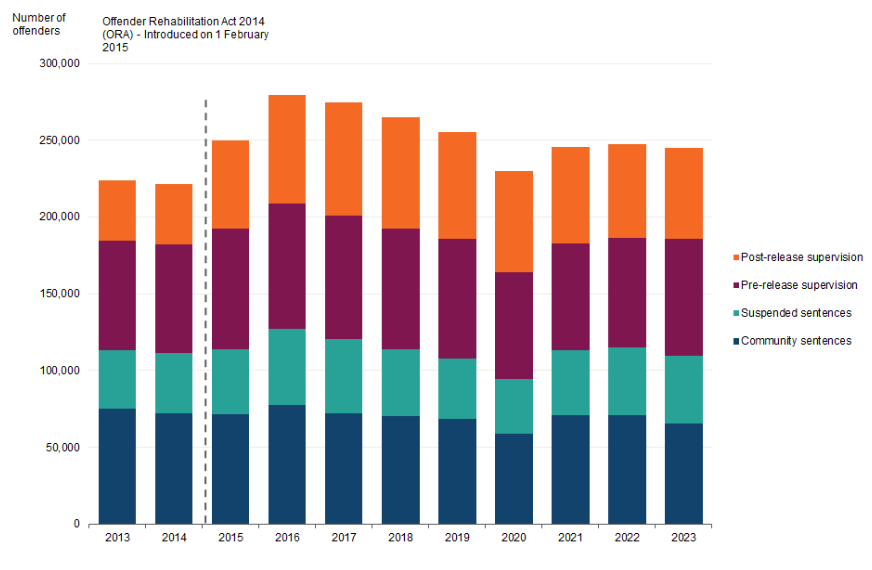
Below are three visualisations taken from the Offender Management Statistics report in 2023. Interpret these graphs, note any trends, any surprising results, and anything you would check in the data if this was your work. Make a note of things the visualisation did well and ways in which it could be improved.
Question 1
Question 2
Question 3