Year | Mean waiting time (weeks) | Standard deviation waiting time (weeks) |
|---|---|---|
2,020 | 13.5 | 10.2 |
2,021 | 19.1 | 15.6 |
2,022 | 20.9 | 13.9 |
2,023 | 22.8 | 14.7 |
Exercise 3: Summary statistics
Question 1
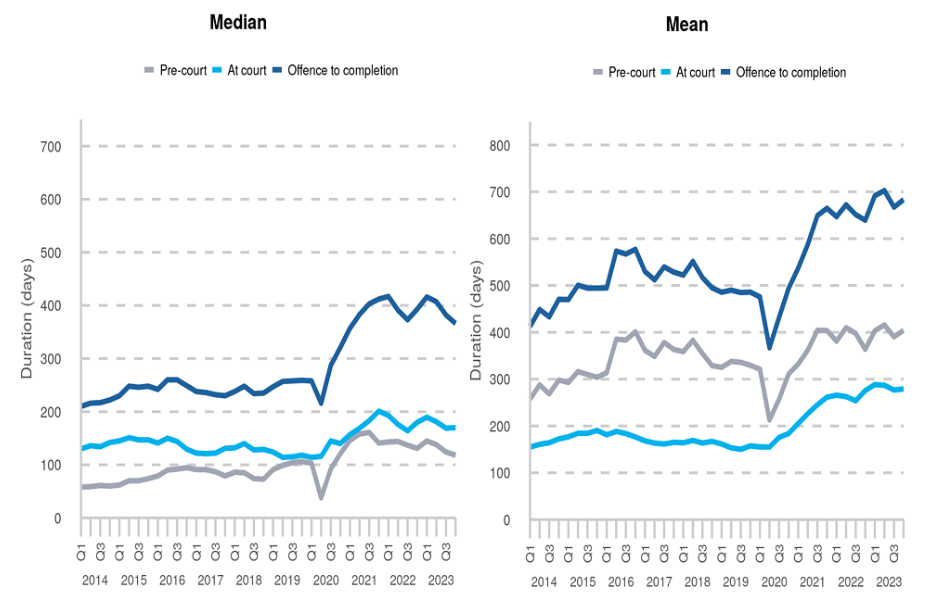
The following line graphs are taken from the Criminal Courts statistics quarterly report, showing the average number of days from offense to completion for defendants at the Crown Court. Which graph is the most appropriate to display the average time and why?
Question 2
The mean and standard deviation of waiting times in weeks for hearings in the Crown Court between 2020 and 2023 are given in the table below. Using this information, what can you tell about the distribution of these times?