Statistical thinking
Welcome
Welcome to the course materials for the Statistical thinking short course. This course was designed for and with the UK Ministry of Justice to encourage data-driven critical thinking.
What is statistical thinking?
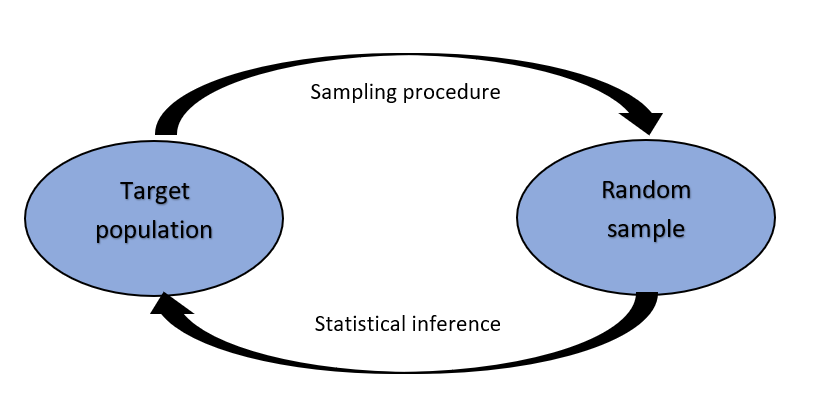
Statistics is the science of data. This includes the collection and storage of data, the visualisation and analysis of samples of data, and the interpretation and communication of results. The overall aim of statistics is to make inferences about a target population of interest based on a random sample.
People tend to assume that statistics involves complex analysis methods but often, the simplest approaches can be the most effective. In this course, we will not focus on analysis methods. Instead, we will be focusing on thinking statistically.
In general, statistical thinking involves describing data and complex systems in relatively simple terms whilst acknowledging uncertainty that exists. The process of statistical thinking involves critically appraising available data, identifying patterns using visualisations and summaries, and communicating results in a clear, concise manner. Statistical thinking could be thought of as data-driven critical thinking.
Why statistical thinking?
Statistical thinking is a necessary skill, not just in work but in personal lives too. We are constantly bombarded by data via the news and social media. Often the claims made here are exaggerated or skewed to fit a certain narrative. Thinking statistically allows us to sift through all these conflicting claims and make our own minds up based on evidence.
Course content
In this course, we will not be introducing any complex analysis methods. Instead, we will be focusing on statistical thinking. This involves thinking critically about data, identifying patterns, and describing the data in relatively simple terms.
Topics that will be covered in this course include:
- The importance of a clear, well-defined research question and how to formulate this
- Common biases and how to recognise them
- Data visualisation as a tool to explore data, investigate trends, and convey important messages
- Summarising data and quantifying differences or trends
- Interpreting inferential statistics
License
I believe that science should not be behind a paywall, that is why these materials are available for free online, licensed under a CC BY-SA 4.0 licence.